| Summary: | Create a WDD like charts for the Performance Test script that we are running regularly | ||||||
|---|---|---|---|---|---|---|---|
| Product: | [QA/Testing] Build Testing | Reporter: | Alexandru Georgescu <alexandru.c.georgescu> | ||||
| Component: | general | Assignee: | Markus Lehtonen <markus.lehtonen> | ||||
| Status: | RESOLVED FIXED | QA Contact: | |||||
| Severity: | normal | ||||||
| Priority: | Medium+ | CC: | benjamin.esquivel, jefro, joshuagloe, markus.lehtonen, melissa, mhalstead, richard.purdie, sgw, sstncr | ||||
| Version: | unspecified | ||||||
| Target Milestone: | 2.4 M1 | ||||||
| Hardware: | x86 | ||||||
| OS: | Multiple | ||||||
| Whiteboard: | TRT | ||||||
| OS type for building Yocto: | --- | Type of Regression: | --- | ||||
| Verified: | Documentation change: | Don't know | |||||
| Bug Depends on: | 6319 | ||||||
| Bug Blocks: | |||||||
| Attachments: |
|
||||||
|
Description
Alexandru Georgescu
2013-08-26 16:04:30 UTC
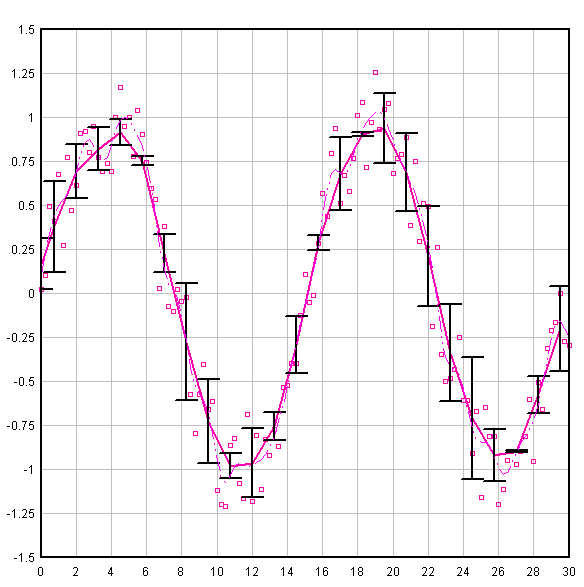
An example of the first chart is up at https://wiki.yoctoproject.org/charts/timing/timing2.html showing the build times for core-image-sato during 1.5. I needed cut and paste data from the wiki and then clean it up in order to generate the chart. Before I continue I would like access to cleaner data. I hope the CSV files before they are transcribed to the wiki will be easier to work with. Can I please have copies of those? Hey Michael, The csv files generated by the build script look like this: thunderbird,master:2ab1bf27f79beadc45e86a26c85fc0b95ae3496f,1.5_M4.rc3-52-g2ab1bf2,1:09:32,12:27.33,1:10:23,5:25.02,0:32.23,0:17.07,0:01.63,26193184,5008012 thunderbird,master:2ab1bf27f79beadc45e86a26c85fc0b95ae3496f,1.5_M4.rc3-52-g2ab1bf2,1:09:06,12:15.77,1:09:55,5:23.13,0:32.62,0:17.01,0:01.64,26192144,5008020 thunderbird,master:0ca5d1fb38157564a2b9452ade32391d18a41b09,1.5_M4.rc3-57-g0ca5d1f,1:08:28,12:51.98,1:10:37,6:53.14,0:33.58,0:17.06,0:01.66,26187432,5006528 thunderbird,master:0ca5d1fb38157564a2b9452ade32391d18a41b09,1.5_M4.rc3-57-g0ca5d1f,1:09:15,12:52.84,1:09:39,5:12.10,0:32.13,0:17.13,0:01.63,26186328,5006488 thunderbird,master:a5973acca3224d64dd80a626febe5d84bd2e3bc4,1.5_M4.rc3-79-ga5973ac,1:08:35,11:58.80,1:15:06,5:24.62,0:32.08,0:16.98,0:01.62,26187900,5006480 thunderbird,master:6b4f7e4b26c51f0c1517c0a697031e7bc488b76f,1.5_M4.rc3-89-g6b4f7e4,1:08:49,12:21.03,1:10:29,5:17.03,0:32.08,0:17.03,0:01.63,26187480,5006604 (each build on a line, can be multiple builds on the same commit) I actually paste the csv into the wiki, see the source: https://wiki.yoctoproject.org/wiki/index.php?title=Performance_Test&action=edit And I just use <tab> </tab> to create a table with a header: <tab class=wikitable sep=comma head=top> hostname,branch:commit,git describe,bitbake core-image-sato,bitbake virtual/kernel,bitbake core-image-sato (rm_work),bitbake core-image-sato -c rootfs,bitbake -p (rm -rf cache/ tmp/cache/), bitbake -p (rm -rf tmp/cache/),bitbake -p,size of tmp dir, size of tmp dir (rm_work) thunderbird,dylan:73f103bf9b2cdf985464dc53bf4f1cfd71d4531f,dylan-9.0.1.rc1,1:05:52,11:04.48,1:05:23,5:16.83,0:30.80,0:17.16,0:02.01,28G,4.7G thunderbird,dylan:e4a0a4c5e419154a34710a1b6c28d4180c6304c3,dylan-9.0.1.rc1-6-ge4a0a4c,1:05:45,11:17.05,1:05:22,5:16.18,0:30.81,0:17.55,0:02.01,28G,4.7G </tab> So the raw data is in the wiki source: https://wiki.yoctoproject.org/wiki/index.php?title=Performance_Test&action=edit Does that help you? I can complete the initial work using the data in the wiki. However this will not work long term. Moving data from a script into a wiki and then from that wiki to another script is unnecessarily complicated. Perhaps you could add a line to your script to push your data to a git repository which would be better for moving data between scripts. Would that work for you? Sure, I'll push it somewhere on poky-contrib and get back to you. Hi Michael, Based on a discussion with RP the idea is that the charts to be displayed with error bars like this example: http://www.dplot.com/examples/error-bars.gif This way we will have an average but also the variance based on the different values obtained by running on the same commit. No web content bugs should have a quarterly milestone. The current implementation can be seen at: https://wiki.yoctoproject.org/charts/perf_milestone/performance_test.html I will prototype graphing of build perf test results on the CustomReports service: https://github.com/fullvlad/CustomReports If you setup a staging instance of the CustomReports server please let me know when it can be seen. I'd like to watch your work there. Moving to milestone to 2.4 along with bug 6319 Similarly to bug 6319, I'm setting the milestone now to 2.4 M1 but would be inclined to close the bug as fixed. Oe-core now has a tool (oe-build-perf-report) for generating graphical test reports, and, such reports are also being automatically generated and sent by the test infrastructure. I will split out the features that are not yet implemented into separate bug(s) before closing this one. Build performance test reports are now being automatically generated and uploaded to wiki.yoctoproject.org for each test run. Links to the latest test reports are found here: https://wiki.yoctoproject.org/wiki/Performance_Test#Daily_Test_Results Closing this bug. Missing features are tracked in separate bugs. |